
ACCELERATION OF
ALTERNATIVES AND
DIRECT INDEXING STRATEGIES
IN HIGH-NET-WORTH PORTFOLIOS
ACCELERATION OF ALTERNATIVES AND DIRECT INDEXING STRATEGIES IN HIGH-NET-WORTH PORTFOLIOS
INTRODUCTION
High-net-worth (HNW) households comprise less than 2% of the U.S. population while controlling nearly half of the nation’s wealth.1 With aggregate investable assets exceeding $31 trillion1, the HNW segment represents an unparalleled client cohort in the wealth management market. Moreover, HNW investors are poised to play a central role in the “great wealth transfer” as U.S. households bequeath an estimated $84 trillion to heirs and charities over the next quarter century.1
The definition of HNW includes households with more than $5 million in investable assets, including households that qualify for ultra-high-net-worth standing by holding $20 million-plus in assets.1 The needs of HNW investors are as unique as their financial situations, with often-complex challenges in areas such as wealth preservation, income generation, tax minimization, and risk management. HNW-focused advisory practices must prioritize these concerns as mission-critical areas to address as they seek specific, innovative, and targeted solutions to help achieve their clients’ objectives.
Successfully serving HNW clients increasingly requires customization as standard portfolio management services go mainstream. Direct indexing and alternative investment solutions stand at the forefront of this trend. Paced by a five-year compound annual growth rate of 12.3%, assets dedicated to direct indexing are expected to reach $825 billion by the end of 2026.2 The global alternatives market is expected to grow at 12% CAGR over the next five years to more than $24 trillion by 2028.3
Hot Topics for High-Net-Worth Advisors
Against this backdrop, we surveyed advisors about their experiences with these strategies amid increasing demand. PGIM Investments partnered with SHOOK® Research to gather insights on how direct indexing and alternatives strategies can help meet the needs of high-net-worth clients. Starting with SHOOK’s database of 25,000 advisors, the survey population was refined to 236 advisors who oversee at least $500 million in client assets and rank in the top quintile of SHOOK’s proprietary advisor-rating scale.
From facilitating generational wealth transfer with direct indexing to enhancing volatility-dampening diversification via alternatives, study findings reveal important and growing roles for these strategies in the financial futures of HNW clients.
01
Advisors Serving HNW Clients Present a Compelling Case for Continued Growth of Direct Indexing and Alternative Strategies
Elements of the HNW Opportunity
Demand for direct indexing and alternative strategies continues to climb amid ongoing efforts to solve for the increasingly complex tax management and portfolio customization needs of high-net-worth investors. Affluent clients are looking for less generic and more differentiated investment strategies. Most advisors foresee continued expansion for both strategies as part of their remit to address key HNW client concerns.
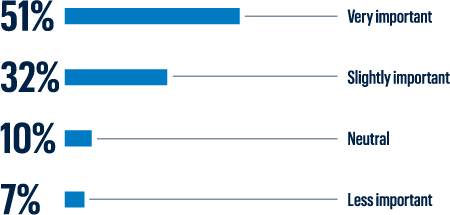
Assessing Direct Indexing’s Importance
More than 80% of advisors consider direct indexing to be very important or slightly important when constructing portfolios relative to other strategies. Advisors who believe direct indexing is less important than other strategies comprise a small minority.

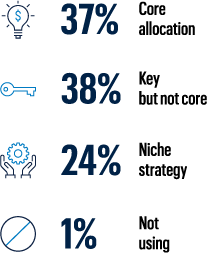
Defining Direct Indexing’s Role
Near-equal numbers of advisors see direct indexing as either a core allocation or a key component in terms of overall portfolio composition. A smaller-yet-significant group views it as a niche strategy used on a limited basis, while three respondents reported not currently employing direct indexing.

Outliers on Adoption
Amid the strategy’s expanding reach, only a small group of advisors surveyed has yet to embrace direct indexing.
Factors Underpinning Inaction
Just over two dozen (27) of more than 200 advisors surveyed do not utilize a direct indexing strategy, with more than two-thirds saying their lack of use results from preference for their current approaches. A handful of advisors are not familiar with direct indexing.

The adoption of alternatives within client portfolios has become more mainstream, and most advisors surveyed expect to increase or maintain their use of alternatives over the next three years. Those advisors planning increases are skewed toward less-liquid alternatives, in particular semi-liquid products.
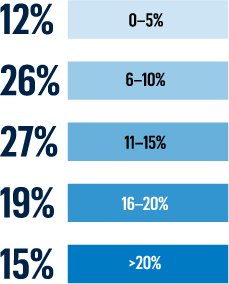
Alternative
Allocation Targets
Between 5% and 15% of overall assets represents a sweet spot for allocations to alternatives, with more than half of advisors targeting that range. A sizable cohort (15%) dedicates 20% or more of portfolio assets to alternatives.
More Sold on
Semi-Liquid Alts
Almost all advisors plan to increase or maintain exposure to semi-liquid alternative investments over the next three years. Fewer advisors report disinterest in semi-liquid alts than liquid alts.

Intrigued by Illiquid Opportunities
Most advisors utilize illiquid alternative investment solutions, with nearly half intending to increase allocations in the next three years. Illiquid alts generated the lowest level of disinterest in the overall alts category.

Less Demand for Liquid Alts
Four in 10 advisors plan to increase their usage of liquid alternative investment solutions over the next three years. Remaining responses mainly split between advisors who plan to maintain current exposure levels and advisors who do not embrace liquid alts.

02
Advisors Value Direct Indexing and Alternative Strategies as Differentiators for Meeting HNW Client Needs
Differentiators in Efficiency, Diversification, and Versatility
Harvesting tax losses and tapping unique return sources unlock potential in ways that align with the needs of HNW investors. Offering the ability to equip portfolios with these capabilities can arm an advisor with enticing competitive advantages.
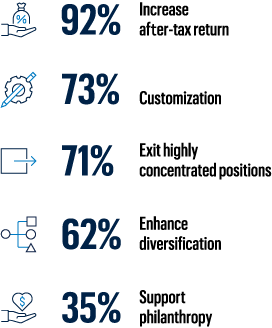
Emphasis on
After-Tax Outcomes
Improved after-tax performance is the primary motivation for advisors to employ direct indexing SMAs for high-net-worth clients. Facilitating customization and the ability to exit concentrated positions rank next.
New Start for
the Next Generation
Three-quarters of advisors believe direct indexing strategies can help address the generational wealth transfer needs of HNW clients.

Change as a Demand Driver
Three-quarters of advisors believe tax law and regulatory changes will contribute to demand for direct indexing strategies.

Alternative Avenues to Diversification
Diversification is the primary reason advisors incorporate alternative investment solutions into the portfolios they manage. Additional rationales that rise to the top include managing risk and offsetting volatility.


03
Client Education and Investment Returns Are Top of Mind When Implementing These Strategies
Competence Breeds Confidence
Advisor responses demonstrate a commitment to client education and due diligence regarding direct indexing and alternative strategies. The biggest contributor to closing the deal with clients is a manager’s ability to deliver outcomes as intended.
Cultivating Client Knowledge
While challenges as a general topic do not appear especially daunting, client education emerges as the chief hurdle cited among respondents. Fewer than one in five advisors see notable obstacles to adoption elsewhere.

All About After-Tax Outcomes
Nine out of 10 advisors believe strong after-tax performance is very important when evaluating direct indexing products. Virtually all respondents are accounted for when advisors who assigned slight importance to after-tax results are added in.

Loss Capture is Critical
Nine out of 10 advisors believe tax-loss capture capabilities are very important when evaluating direct indexing products. Nearly all agree that tax-loss capture is either slightly or very important.

Key Considerations for Alts Evaluations
Investment returns are the most important factor advisors consider when evaluating alternative investment opportunities. The financial stability of the manager responsible for generating those returns is the next most significant influence in the evaluation process.

04
Direct Indexing Can Make Your Portfolio Work Harder for You
Use Case Example
John and Jan hold $2 million taxable investment portfolios. John invests $1 million in an S&P 500 Index fund. Jan invests $1 million in an S&P 500-based direct indexing SMA strategy.
Each invests the remaining $1 million in the same mix of traditional and alternative strategies, which at the end of one year generates a 10% short-term gain of $100,000.
Both investors are subject to a 40.8% short-term capital gains tax rate. Jan’s SMA strategy offers a 7.4% tax-loss harvesting opportunity based on the S&P 500’s average loss availability over 30 years.
John Smith, Index Fund Investor
- John can’t tax-loss harvest within his index fund.
- Therefore, he must pay $40,800 ($100,000 x 40.8%) in taxes on his realized short-term gains.
Jan Benson, Direct Indexing SMA Investor
- Jan uses the short-term volatility to harvest losses (7.4% assumed loss-capture ratio2 of her investment, or $74,000).
- Realized losses offset gains, reducing her taxable gain to $26,000.
- Jan’s tax bill is just $10,608 in taxes ($26,000 x 40.8%).
- Jan’s ending portfolio value is $30,192 larger than John’s due to tax savings.

Source PGIM Investments. For illustrative purposes only. ¹ Assumes short-term capital gains for top federal tax bracket of 37% plus net investment income tax of 3.8%. An investor in a lower tax bracket would realize lower tax savings.2 7.4% loss harvesting opportunity based on average available losses in the S&P 500 over the past 30 years. Not intended to represent the performance of any specific product or strategy. These numbers are estimated tax loss capture opportunity numbers based on historical data and are not guaranteed. The actual tax loss capture opportunity that is experienced may vary substantially and be less than anticipated. Loss capture shown does not reflect inclusion of any fees or trading costs. How the Analysis was done: Using closing market price daily data over rolling 1-year periods, each of the 11 Select Sector SPDRs max drawdown from the start of each period was multiplied by the monthly starting weight of the sector in the S&P 500 Index. The drawdown percentages are added together to get the Tax Loss Capture (TLC) opportunity for the period. 8,348 data points were analyzed (start dates used 1/1/1990 to 12/31/2021). Each TLC number was put into opportunity deciles. There were eight 0% tax loss capture outcomes. Actual results may vary substantially. Past performance, volatility and Tax Loss Capture figures should not be relied upon as an indicator of future performance, volatility or Tax Loss Capture. Tax losses may be carried forward on a federal tax level, but not on a state tax level as not every state allows for tax loss carry forward. Please consult with your tax advisor as PGIM Investments does not provide tax advice. Investors may be able to use losses from their Direct Indexing account to offset gains in other investments. After netting out short-term gains and losses and long-term gains and losses, investors have the option to use long-term losses to offset their short-term gains (and vice versa). Using short-term losses to offset long-term gains is generally not recommended because the long-term gains are taxed at a reduced rate. Using the short-term losses to offset regular income or carry them forward might be a better use of any short-term losses that might be left over at the end of the year. The after-tax returns are subject to the limitations of the specific calculation methodology applied and the tax rate assumptions made. The after-tax returns shown may not reflect a client’s actual after-tax performance due to differences in tax rates relative to those used in the two scenarios and other circumstances. As examples, clients with lower applicable tax rates, capital loss carryforwards or no capital gains outside the portfolio are likely to experience lower levels of after-tax returns. In addition, estimated tax benefits relating to a tax loss harvesting transaction are added to portfolio returns in the same year as the transaction, even though the tax benefits do not become available until the following tax year.
05
Top Takeaways for Asset Managers
We asked advisors for thoughts on how managers could support their business growth and help them use direct indexing and alternative strategies as part of that success. Here’s what they said:
Technology and Due Diligence
Advisors prefer strategies that leverage robust technology guided by managers with repeatable processes developed through demonstrated expertise in their fields.
Education
Given that these can be new concepts to some clients, advisors seek strategies with transparent processes and managers committed to detailing the advantages and risks involved.
Solid Support
To see them as a partner in the future success of their firms, advisors want managers who maintain open lines of communication to ensure access to support when needed.
Methodology
Population
A representative sample of 544 advisors was selected from the SHOOK Research database of more than 25,000 advisors who have completed surveys with SHOOK Research in the past. Each advisor participating in the survey was ranked by SHOOK during the past 12 months. The survey population was limited to advisors who rated 8 or higher on SHOOK’s 10-point scale and who also had a minimum of $500 million in assets under management. Channels included were registered investment advisors, independent broker-dealers, regionals, and all major wirehouses.
Questionnaire
The questions were designed using a Likert scale to gauge the intensity of the participants’ opinions. Telephone interviews, each lasting approximately 15 minutes, for this study were conducted during July and August 2024. Interviews were completed with 236 advisors within the desired time interval. In some cases, respondents did not supply answers, resulting in slightly varying response rates for some questions. As a result, direct indexing responses were analyzed from 208 advisor interviews, and alternatives responses were analyzed from 233 advisor interviews.
About PGIM Investments
At PGIM Investments, we provide access to active investment strategies across the global markets in the pursuit of consistent outperformance for investors. We’re part of PGIM, the global investment management business of Prudential Financial, Inc.—the world’s 14th-largest investment manager with more than $1.4 trillion in assets under management (AUM)4 and a company that individuals and businesses have trusted for over 145 years.
About SHOOK Research
SHOOK Research is the world’s only advisor research organization focusing on the quality of financial advisors. The rankings, published in Forbes and other publications, are established after SHOOK conducts extensive due diligence, including telephone, virtual, and in-person interviews. The company hosts a series of top advisor summits nationally where advisors assemble to offer insights and exchange best practices. SHOOK’s mission is to foster an environment that elevates professionalism, raises client confidence and helps investors find trusted advisors. SHOOK Research’s philanthropy has helped raise more than $300 million. SHOOK is independent and receives no compensation from financial advisors, their firms or companion media in exchange for ranking advisors.
1 The Cerulli Report: U.S. High-Net-Worth and Ultra-High-Net-Worth Markets 2023
2 Cerullli Associates: The Case for Direct Indexing: Differentiation in a Competitive Marketplace, December 2022
3 EY Alternatives Market Study, August 2024
4 Prudential Financial, Inc. is the 14th-largest investment manager (out of 411) in terms of global AUM based on the Pensions & Investments Top Money Managers list published on 6/10/2024. This ranking represents assets managed by Prudential Financial as of 12/31/2023.
This material is being provided for informational or educational purposes only and does not take into account the investment objectives or financial situation of any client or prospective clients. The information is not intended to be, nor should it be construed as investment, insurance, financial, tax, or legal advice, and is not a recommendation. Clients seeking information regarding their particular investment needs should contact their financial professional.
SHOOK RESEARCH, LLC is not affiliated with PGIM Investments, Prudential Financial, or any of its companies or businesses. PGIM Investments commissioned this research and this survey and report was prepared by PGIM Investments and SHOOK RESEARCH. SHOOK RESEARCH, does not endorse or recommend PGIM Investments or its investment advisory services. Any views or opinions expressed herein reflect solely the views of the advisors who were surveyed in connection with this survey and, in certain cases, SHOOK Research and/or PGIM Investments, and such views or opinions are subject to change without notice and may differ from opinions expressed by others. Neither SHOOK Research nor PGIM Investments has independently verified the information received from the advisors surveyed and no representation is made as to the accuracy of such information. Any projections, expectations or other forward-looking statements set forth herein are based on assumptions that are believed by SHOOK Research and PGIM Investments to be reasonable as of the date hereof. Neither SHOOK Research nor PGIM Investments has any obligation to update any such statements. Actual results are inherently uncertain and are subject to many factors, changing market conditions and general economic conditions, and may vary materially from the themes set forth herein. Nothing herein constitutes investment advice or recommendations, and this summary paper should not be relied upon as a basis for making an investment decision.
S&P 500® Index is a total return, float-adjusted market capitalization-weighted index of 500 common stocks chosen for market size, liquidity, and industry group representation to represent U.S. equity performance. The S&P 500 Index is a product of S&P Dow Jones Indices LLC and/or its affiliates and has been licensed for use by PGIM Investments. Copyright © 2024 S&P Dow Jones Indices LLC, a division of S&P Global, Inc., and/or its affiliates. All rights reserved. Redistribution or reproduction in whole or in part are prohibited without written permission of S&P Dow Jones Indices LLC. For more information on any of S&P Dow Jones Indices LLC’s indices please visit www.spdji.com. S&P® is a registered trademark of S&P Global and Dow Jones® is a registered trademark of Dow Jones Trademark Holdings LLC. Alpha: alpha refers to excess returns earned on an investment above the benchmark return.
The availability of tax alpha is highly dependent upon the initial date and time of investment as well as market direction and security volatility during the investment period. Tax loss harvesting outcomes may vary greatly for clients who invest on different days, weeks, months and all other time periods. A client’s tax alpha will depend on the client’s individual circumstances, which are outside of PGIM Custom Harvest’s knowledge and control.
PGIM Investments LLC is an investment adviser registered with the United States Securities and Exchange Commission. ©2024 Prudential Financial, Inc. and its related entities. Prudential Financial, Inc. of the United States is not affiliated in any manner with Prudential plc, incorporated in the United Kingdom or with Prudential Assurance Company, a subsidiary of M&G plc, incorporated in the United Kingdom.
For more information, call the PGIM Investments Sales Desk at (800) 257-3893 or visit pgiminvestments.com.
4040064
